Visualizing Python Dependencies with Pydeps
When you write Python and sprinkle imports everywhere, sooner or later you run into a circular import error. By the time it happens, you usually have dozens of classes already, and it's not easy to figure out where exactly the cycle is.
I recently had to track down a circular import at work, and that's when I discovered Pydeps. It helped me not only fix the circular reference but also turned out to be a big help during refactoring.
What is Pydeps
Pydeps is a library that visualizes the dependencies between Python classes.
GitHub: https://github.com/thebjorn/pydeps
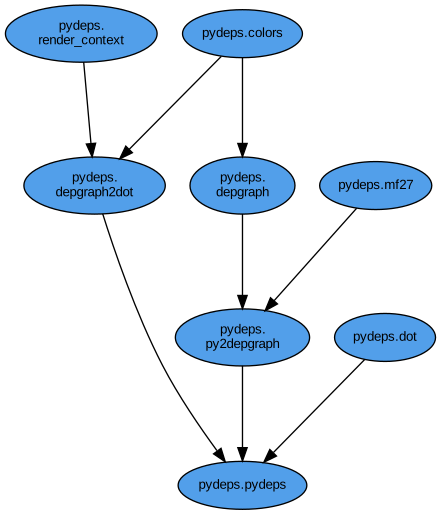
Here is what you get when you analyze the Pydeps library with Pydeps itself.
Installing Pydeps
Installation is a simple pip install. Note that graphviz must already be installed. Graphviz is graph visualization software that renders abstract graphs and networks as diagrams. As far as I can tell, pydeps analyzes the dependencies, generates a file graphviz can interpret (an svg or dot file, etc.), and then calls graphviz to display the dependency graph.
First, install graphviz from the link below. I'm on Windows, so I used the EXE installer.
graphviz: http://www.graphviz.org/download/
Once graphviz is installed, install pydeps with pip:
A quick example
I put together a small Python project like the one below. It's deliberately contrived to trigger a circular import error, so the content itself doesn't mean much.
Running main.py produces the circular import error as expected:
python main.py

Traceback (most recent call last):
  File "C:\Users\expyh\Desktop\test\main.py", line 1, in <module>
    import a
  File "C:\Users\expyh\Desktop\test\a.py", line 1, in <module>
    import b
  File "C:\Users\expyh\Desktop\test\b.py", line 1, in <module>
    import c
  File "C:\Users\expyh\Desktop\test\c.py", line 3, in <module>
    name = "expyh" + a.today
AttributeError: partially initialized module 'a' has no attribute 'today' (most likely due to a circular import)
To spot the circular reference, let's run the pydeps command in the terminal:
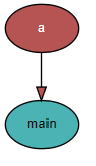
It shows that main.py imports a — but that alone doesn't reveal the circular relationship. To explore deeper, you need the --max-bacon option.
--max-bacon INT
exclude nodes that are more than n hops away (default=2, 0 -> infinite)
On top of that, applying reverse to the arrow direction makes the graph match the dependency direction you'd see in a class diagram.
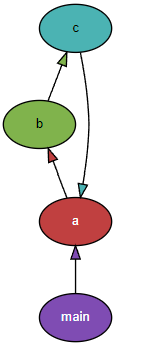
Now you can see that a.py / b.py / c.py reference each other.
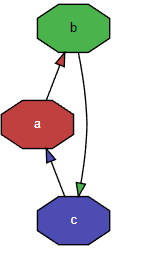
If there are so many files that it's hard to spot by eye, you can show only the cycles with --show-cycles.
Exporting the dependency graph to a file
In my case, when I used it at work, pydeps failed to recognize graphviz and threw the following error:
    ERROR:
               cannot find 'dot'

               pydeps calls dot (from graphviz) to create svg diagrams,
               please make sure that
As a workaround, you can have pydeps generate an svg or dot file and then run graphviz's dot command separately to view the graph. Use --noshow to keep pydeps from calling an external program, --show-dot to make it emit the dot output, and redirect that with > into a graph.dot file.
--noshow
don't call external program to display graph
--show-dot
show output of dot conversion
The generated output.dot looks like this:
digraph G {
    concentrate = true;

    rankdir = BT;
    node [style=filled,fillcolor="#ffffff",fontcolor="#000000",fontname=Helvetica,fontsize=10];

    a [fillcolor="#c04040",fontcolor="#ffffff"];
    b [fillcolor="#80b34c"];
    c [fillcolor="#4cb3b3"];
    main [fillcolor="#7f4cb3",fontcolor="#ffffff"];
    c -> a [fillcolor="#4cb3b3"];
    main -> a [fillcolor="#7f4cb3"];
    a -> b [fillcolor="#c04040"];
    b -> c [fillcolor="#80b34c"];
}
Since graphviz is already installed, the dot command is available in the terminal. Running it as below renders the graph as an svg file. If you want a different output format, see the -T option at the link below.
Reference: https://graphviz.org/doc/info/command.html